Skip to content

For HR Operations

The four numbers a VP of HR Operations has to defend

You own the service centre. You are accountable for cost to serve, SLA attainment and consistency across regions. Most HR functions cannot evidence any of the three.

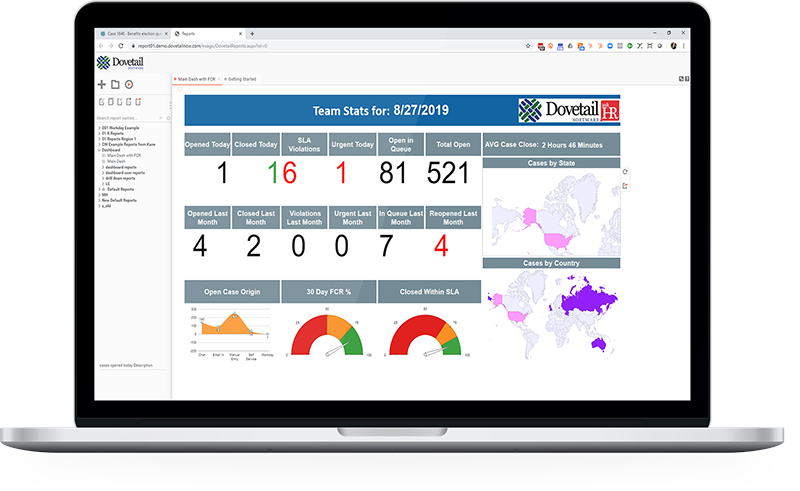
Dovetail HR case management reporting dashboard with service level and volume analytics

#1

Five consecutive years in HR Service Delivery

Sapient Insights 2025-2026 HR Systems Survey, 28th edition. 10,000+ HR professionals across 4,670 organisations.

8 months

Payback period, fastest in the category

G2 payback metric, against a category average of 14 months.

3 of 3

Enterprise categories ranked #1

HR Service Delivery Help Desk, Portal and Content Management. A clean sweep.

What you get to prove

Four numbers that end the argument

Resourcing conversations are won with data. These are the metrics the platform gives you from day one.

Cost per case

Cost to serve by category, tier and region, so you can defend the model or change it.

Cost to serve

SLA attainment

Time to first response and time to resolve against target, by team and case type.

Service levels

First contact resolution

How much your tier 1 actually closes, and what is escalating and why.

Tier efficiency

Deflection

Volume absorbed by self service and knowledge before it ever reaches a person.

Capacity returned

Tiering

Where your volume actually goes

Tiering only works if you can see the demand. Routing rules, knowledge and self service determine what reaches tier 1, and reporting tells you whether the model is holding.

  • Tier 0 deflection through portal and knowledge search
  • Routing by category, region and sensitivity so tier 1 can close first time
  • Escalation that carries context and permissions intact
  • Volume and handle time by tier, so you staff to demand

See HR shared services

Dovetail HR case management reporting dashboard with service level and volume analytics

Build your case

Get a costed case for change in three minutes

Assess your HR and ER operation, surface the cost and operational risk hiding inside it, and leave with a maturity score, a recoverable cost estimate and an editable leadership deck.

  • Maturity score across the core dimensions of HR and ER service delivery
  • Recoverable cost and capacity estimate built from your own answers
  • Executive PDF report and an editable leadership presentation
  • Prioritised improvement roadmap

About 3 minutes. Your score, report and slide deck are ready instantly.

72/100

Maturity score

$565k

Recoverable a year

8.6 FTE

Capacity freed up

Example figures. Your version is built entirely from your answers.

Model it against your own numbers

Take the assessment first. Bring the output to the demo and we will work from your figures rather than ours.